

Published October 2026. Data period: January 1 to September 30, 2026.
How much mobile data do people actually use when they travel abroad? A phone's own counter shows only one person's history. This report measures it across a random sample of trips.
The report is based on anonymized, real-world network usage from travelers using a pay-as-you-go travel eSIM provided by Bcengi. From all eligible travel periods from 2026 we drew a statistically selected, stratified random sample of 10,000 travel periods and analyzed how much data each one used, for how long, in which countries, and how often travelers came back for another trip. For readability we call each travel period a trip.
Key Findings
- The typical trip used about 2 GB. The median travel period used 2.06 GB over a median of 11 days, about 195 MB a day. 35.5% of trips used less than 1 GB and 70.7% used less than 5 GB.
- A 7-day trip used a median of 1.38 GB. 75% of trips of 6 to 8 days used less than 3.24 GB and 90% used less than 6.50 GB. A 3-day trip used a median of 0.50 GB and a 14-day trip 3.16 GB.
- Trips of the same length vary enormously. Among 4 to 7 day trips, the traveler at the 90th percentile used 42 times as much data as the traveler at the 10th percentile (5.38 GB against 0.13 GB).
- Daily use is flat from 4 days on. From 4-day trips to stays of more than a month, the median stayed at 0.22 to 0.23 GB a day.
- A heavy tenth uses more than everyone else combined. The heaviest 10% of trips used 53.2% of all the data in the sample. The lightest half used 5.9%.
- Close to half of trips used data in more than one country. 47.7% of trips used data in two or more countries (40.5% if a country needs 50 MB of use to count), and 86.9% of trips longer than 30 days did.
- In a hypothetical comparison, about half of trips would have used less than half of a 5 GB allowance. 54.2% of trips would have used less than half of a 5 GB allowance, while 29.3% would have needed more than 5 GB.
- Travelers come back, often months later. The median returning traveler started their next trip 39 days after the last one ended. 38.1% came back after 60 or more days, and 26.3% after 90 or more.
How Much Mobile Data Do Travelers Actually Use?
The median international trip in the sample used 2.06 GB of mobile data. The median trip lasted 11 days, and median daily use was 0.195 GB, or about 195 MB a day.
The distribution is heavily skewed. A quarter of trips used less than 0.47 GB, while a quarter used more than 5.98 GB. One trip in ten used more than 13.5 GB, and one in twenty more than 20.7 GB.
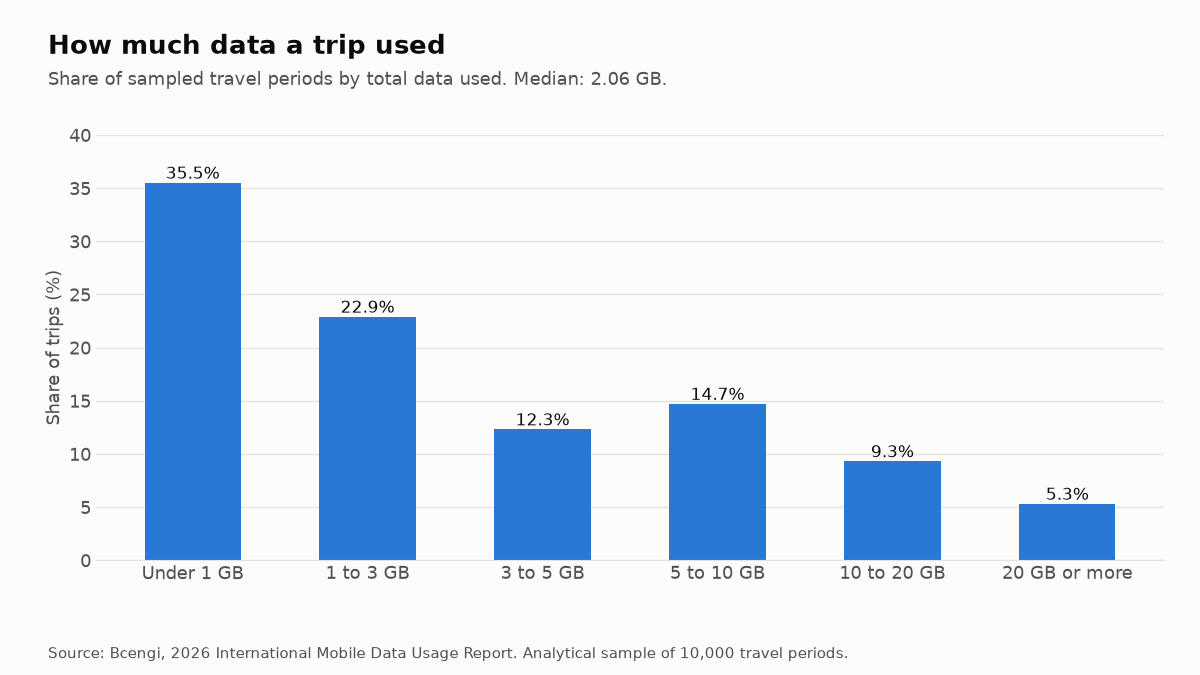
Share of trips by total data used:
- Under 1 GB: 35.5%
- 1 to 3 GB: 22.9%
- 3 to 5 GB: 12.3%
- 5 to 10 GB: 14.7%
- 10 to 20 GB: 9.3%
- 20 GB or more: 5.3%
Cumulatively, 35.5% of trips used less than 1 GB, 58.4% less than 3 GB, 70.7% less than 5 GB and 85.4% less than 10 GB. 14.6% used 10 GB or more. At the light end, 12.7% of trips used less than 100 MB.
Very short trips pull the figures down. One-day periods were 10.7% of trips and used a median of 44 MB. Leaving them out, the median trip used 2.62 GB and 28.2% of trips used less than 1 GB.
Why the median, not the average
Because a small group of heavy users accounts for most of the data, an average describes almost nobody. The heaviest 10% of trips used 53.2% of all the data in the sample and the heaviest 1% used 16.0%, while the lightest half of trips used 5.9%. This report therefore uses medians and percentiles throughout.
How Much Data Do You Need for a 3-Day, 7-Day or 14-Day Trip?
In the 2026 research sample, a 3-day trip used a median of 0.50 GB, a 7-day trip 1.38 GB and a 14-day trip 3.16 GB. Each length includes trips one day shorter or longer.
- 3-day trip (2 to 4 days): median 0.50 GB. 75% used less than 1.32 GB, 90% less than 2.84 GB and 96.1% less than 5 GB.
- 7-day trip (6 to 8 days): median 1.38 GB. 75% used less than 3.24 GB, 90% less than 6.50 GB and 84.3% less than 5 GB.
- 14-day trip (13 to 15 days): median 3.16 GB. 75% used less than 6.48 GB, 90% less than 11.9 GB and 65.4% less than 5 GB.
How much mobile data do travelers use on a 7-day trip?
Travelers on trips of 6 to 8 days used a median of 1.38 GB. A quarter used less than 0.52 GB, 75% used less than 3.24 GB and 90% stayed below 6.50 GB. The median was between 1.24 GB and 1.48 GB under every alternative trip definition we tested.
Data use by trip length group
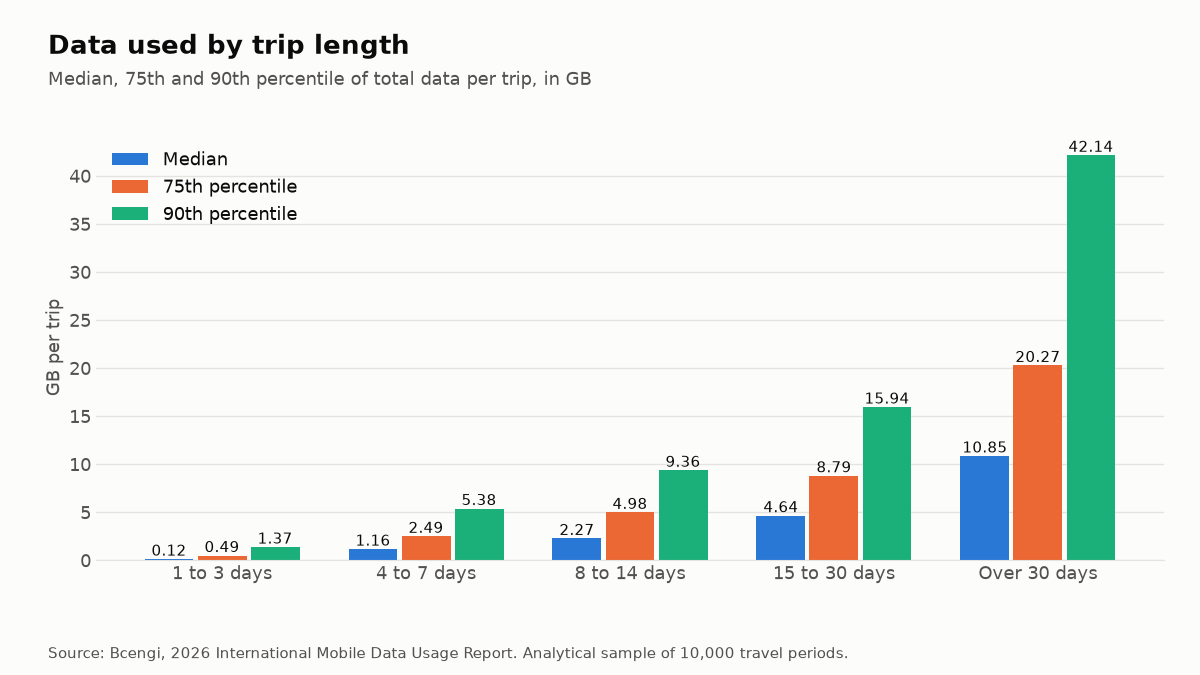
- 1 to 3 days: median 0.12 GB; 25th percentile 0.02 GB; 75th percentile 0.49 GB; 90th percentile 1.37 GB.
- 4 to 7 days: median 1.16 GB; 25th percentile 0.49 GB; 75th percentile 2.49 GB; 90th percentile 5.38 GB; 95th percentile 7.97 GB.
- 8 to 14 days: median 2.27 GB; 25th percentile 0.89 GB; 75th percentile 4.98 GB; 90th percentile 9.36 GB; 95th percentile 13.65 GB.
- 15 to 30 days: median 4.64 GB; 25th percentile 2.12 GB; 75th percentile 8.79 GB; 90th percentile 15.94 GB; 95th percentile 22.38 GB.
- Over 30 days: median 10.85 GB; 25th percentile 4.76 GB; 75th percentile 20.27 GB; 90th percentile 42.14 GB; 95th percentile 62.8 GB.
These groups are wider bands, so their figures differ from the 3, 7 and 14-day figures above. Trip length here is measured from the first to the last day on which the eSIM used data abroad. Days abroad without any data use at the start or end of a trip are not visible, so very light trips can look shorter than they were.
Trip Length Is Only Part of the Story
Trip length matters most, but leaves half the variation unexplained. The spread within each trip length is wide:
- 4 to 7 days: the 90th percentile used 42 times as much as the 10th (5.38 GB against 0.13 GB).
- 8 to 14 days: 37 times (9.36 GB against 0.25 GB).
- 15 to 30 days: 18 times (15.94 GB against 0.89 GB).
- Over 30 days: 22 times (42.14 GB against 1.9 GB).
Put another way: pick two travelers at random who both took an 8 to 14 day trip. In 40.0% of such pairs, one used at least five times as much data as the other, and in 24.9% at least ten times as much.
Destination, region and home country each explain far less of the variation than trip length; the figures are in the methodology.
Daily use is flat from 4 days on
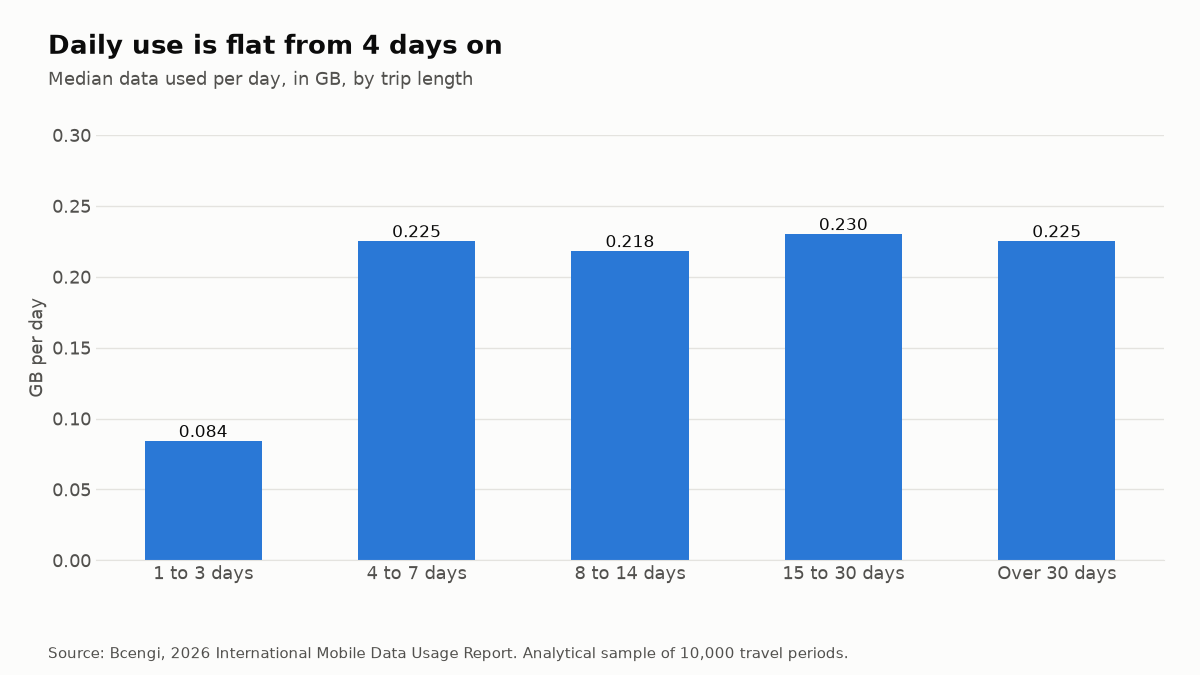
- 1 to 3 days: 0.084 GB a day
- 4 to 7 days: 0.225 GB a day
- 8 to 14 days: 0.218 GB a day
- 15 to 30 days: 0.230 GB a day
- Over 30 days: 0.225 GB a day
Travelers on month-long trips did not use less per day than travelers on week-long trips, nor more. Total use grows with the number of days. Only the shortest trips are lighter, and their short recorded length partly reflects days without data use.
Which Destinations Use the Most Mobile Data?
China had by far the highest daily data use: a median of 0.42 GB a day, against 0.27 GB for Japan, the next highest. That gap is larger than the statistical uncertainty. On total data per trip, China (4.69 GB), Italy (4.23 GB) and Spain (4.16 GB) led, but their uncertainty ranges overlap, so the order among the three is not reliable. Italy and Spain had long stays, with median trips of 16 and 18 days.
The lowest daily use was in Switzerland and Mexico, both at a median of 0.097 GB a day, with India next at 0.137 GB. Switzerland also had the lowest total per trip, a median of 0.65 GB, with Mexico close behind at 0.94 GB.
A price caveat applies to Mexico and India. At Bcengi's rates, Mexico ($4.86 per GB on October 1, 2026) was the most expensive destination per GB of those shown, and India ($3.07) was among the three most expensive. Their low use may partly reflect travelers using less where data costs more. Across all destinations shown, price and daily use were only weakly related, so this caveat is specific to these destinations.
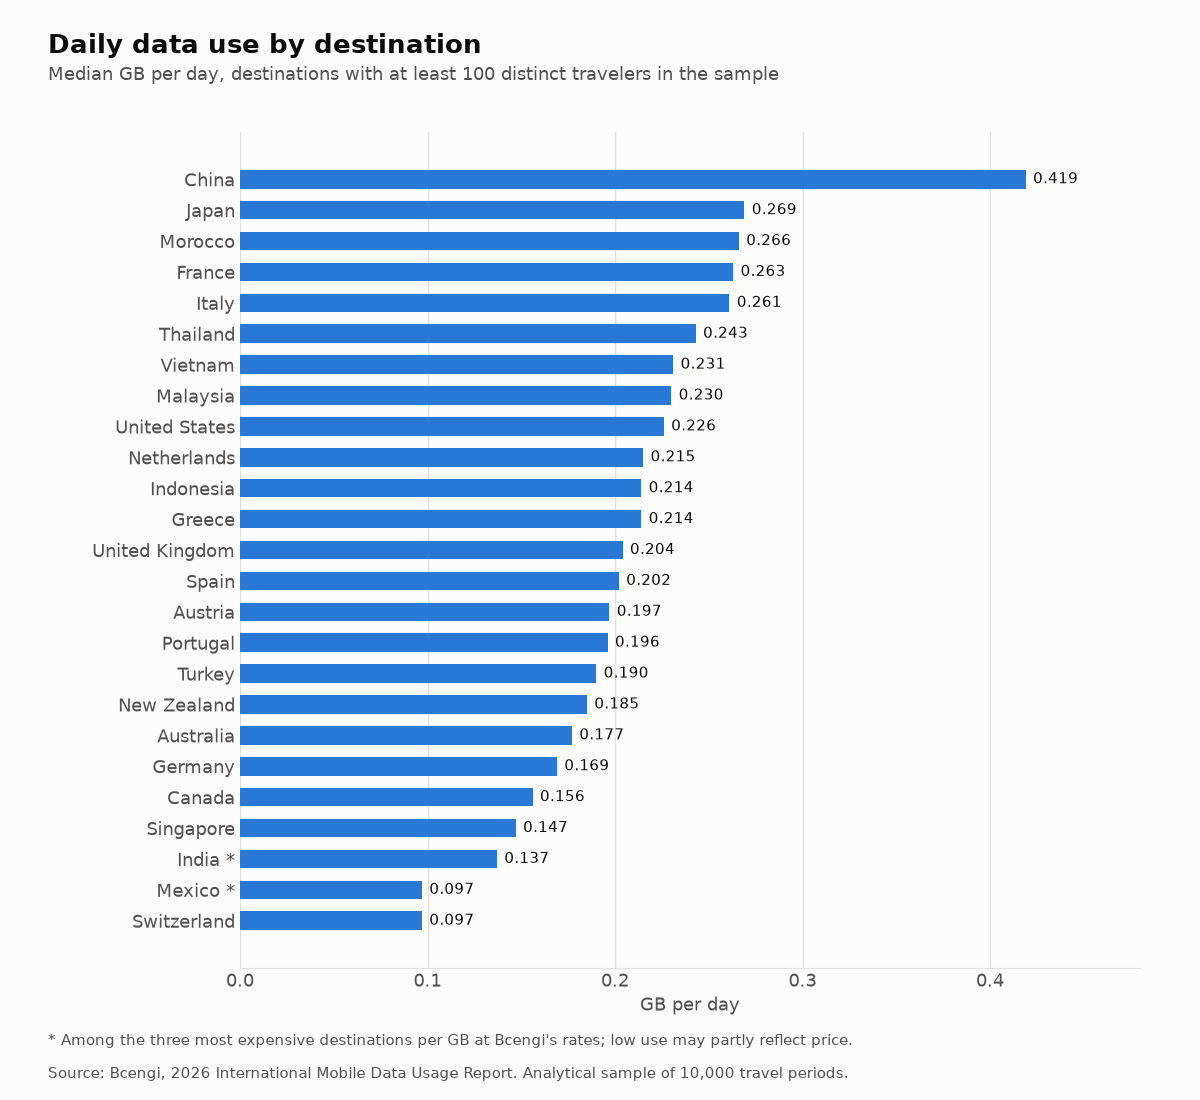
Destinations shown, ordered by median data per trip (median per trip; median per day; median trip length):
- China: 4.69 GB; 0.419 GB a day; 9 days
- Italy: 4.23 GB; 0.261 GB a day; 16 days
- Spain: 4.16 GB; 0.202 GB a day; 18 days
- Portugal: 3.78 GB; 0.196 GB a day; 14 days
- Thailand: 3.33 GB; 0.243 GB a day; 14 days
- Japan: 3.27 GB; 0.269 GB a day; 13 days
- France: 3.16 GB; 0.263 GB a day; 10 days
- United Kingdom: 2.92 GB; 0.204 GB a day; 16 days
- Vietnam: 2.64 GB; 0.231 GB a day; 14 days
- New Zealand: 2.57 GB; 0.185 GB a day; 15 days
- Indonesia: 2.47 GB; 0.214 GB a day; 10 days
- Austria: 2.40 GB; 0.197 GB a day; 11 days
- United States: 2.39 GB; 0.226 GB a day; 10 days
- Australia: 2.35 GB; 0.177 GB a day; 12 days
- Greece: 2.28 GB; 0.214 GB a day; 11 days
- Morocco: 2.21 GB; 0.266 GB a day; 8 days
- Netherlands: 2.14 GB; 0.215 GB a day; 11 days
- Germany: 2.00 GB; 0.169 GB a day; 11 days
- Canada: 1.71 GB; 0.156 GB a day; 11 days
- India: 1.40 GB; 0.137 GB a day; 9 days (price caveat)
- Turkey: 1.35 GB; 0.190 GB a day; 7 days
- Malaysia: 0.97 GB; 0.230 GB a day; 4.5 days
- Singapore: 0.96 GB; 0.147 GB a day; 6 days
- Mexico: 0.94 GB; 0.097 GB a day; 8 days (price caveat)
- Switzerland: 0.65 GB; 0.097 GB a day; 9 days
A destination is a trip's main country, the one where it used the most data. Destinations are shown only when at least 100 different travelers in the sample had them as their main country, so that a handful of travelers is less likely to drive a result. The longest median trips were to Spain (18 days), Italy and the United Kingdom (16 days each); the shortest to Malaysia (4.5 days) and Singapore (6 days).
Mobile Data Usage Around the World
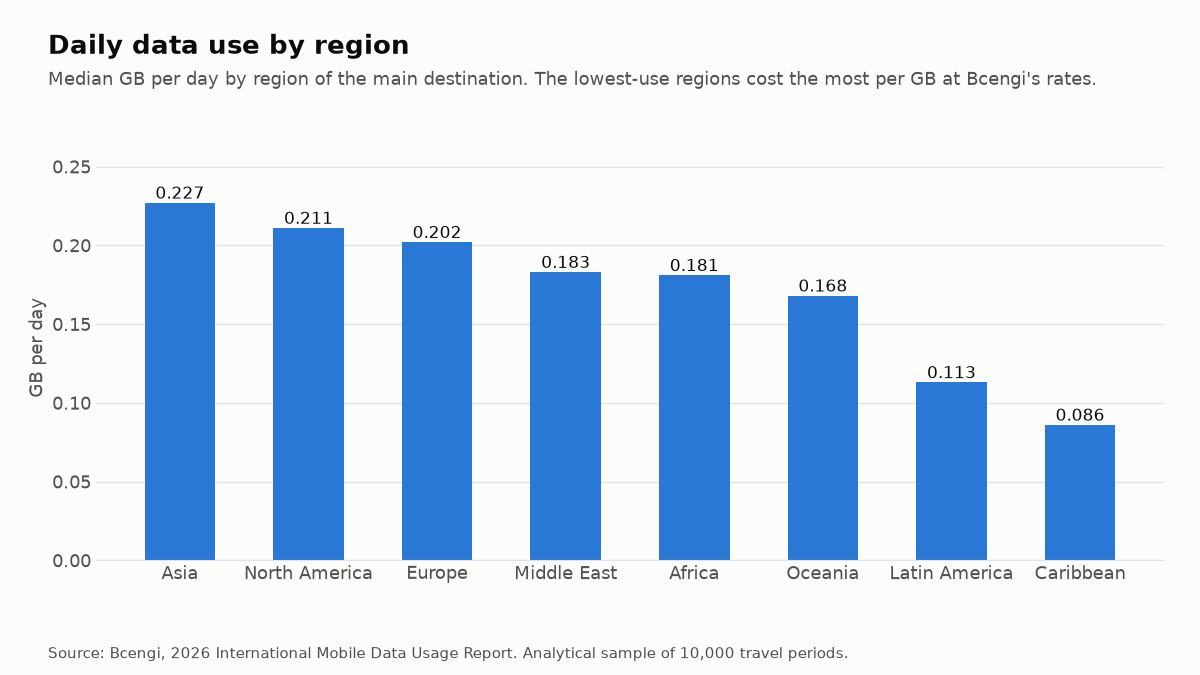
By region, trips centered on Asia, North America and Europe used the most data per day, and trips to the Caribbean and Latin America the least. The regional ranking should be read with care: at Bcengi's rates the lowest-use regions are also the most expensive per GB, and across the eight regions price and daily use move strongly in opposite directions (a rank correlation of -0.69). Part of the regional difference may be price, not travel style.
Region of the main destination (median per day; median per trip; median trip length):
- Asia: 0.227 GB a day; 2.26 GB; 10 days
- North America: 0.211 GB a day; 2.22 GB; 10 days
- Europe: 0.202 GB a day; 2.37 GB; 12 days
- Middle East: 0.183 GB a day; 0.95 GB; 5 days
- Africa: 0.181 GB a day; 1.80 GB; 9 days
- Oceania: 0.168 GB a day; 2.13 GB; 13 days
- Latin America: 0.113 GB a day; 1.27 GB; 9 days
- Caribbean: 0.086 GB a day; 0.81 GB; 8 days
Where travelers come from matters too
Australians (a median of 4.90 GB per trip, over 18 days) and New Zealanders (4.33 GB over 21 days) used more than twice as much per trip as Americans (1.97 GB over 12 days) and Britons (1.81 GB over 11 days). Longer trips explain part of the difference. Australians also used more per day: 0.259 GB, against 0.176 GB for Americans and 0.169 GB for Britons.
How Common Is Multi-Country Travel?
47.7% of trips used mobile data in two or more countries. 24.8% covered three or more countries, 8.4% five or more and 1.1% ten or more. The median multi-country trip covered 3 countries.
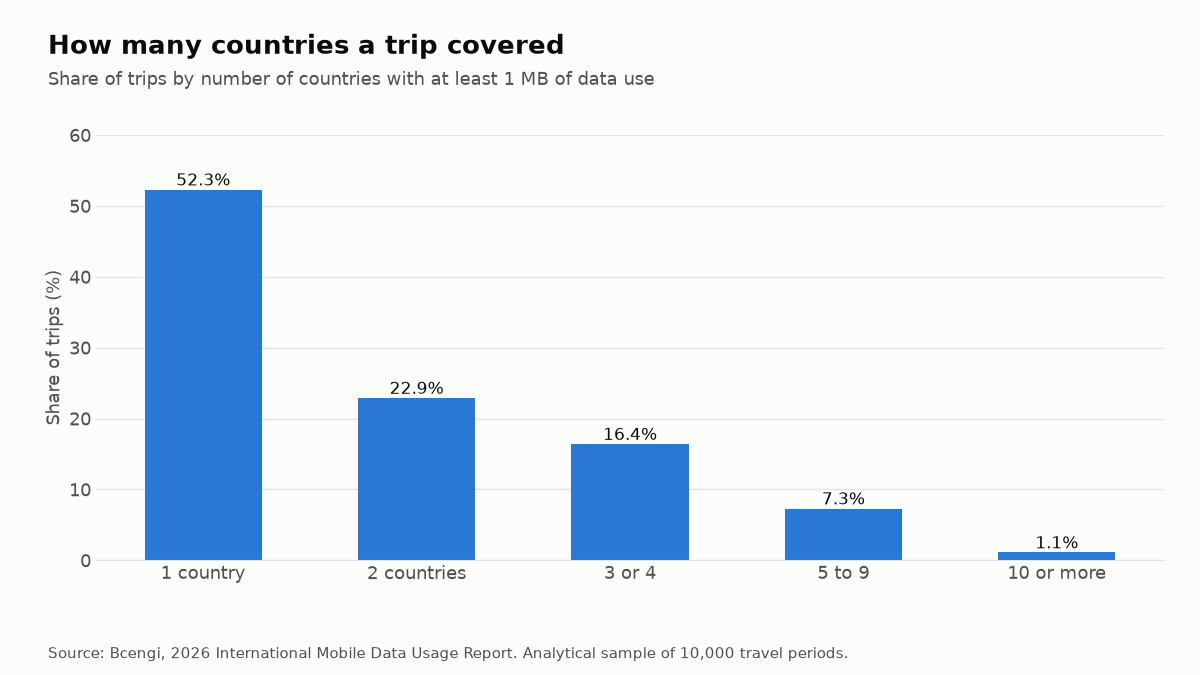
- 1 country: 52.3%
- 2 countries: 22.9%
- 3 or 4 countries: 16.4%
- 5 to 9 countries: 7.3%
- 10 or more countries: 1.1%
A country counts as visited when at least 1 MB of data was used there, which filters out a phone briefly catching a network across a border. The share depends on that threshold: it is 47.7% at 1 MB, 44.7% at 10 MB and 40.5% at 50 MB.
Multi-country travel rises steeply with trip length: 12.0% of 1 to 3 day trips, 26.7% of 4 to 7 day trips, 45.4% of 8 to 14 day trips, 73.7% of 15 to 30 day trips and 86.9% of trips longer than 30 days. Among trips centered on Europe, 52.2% were multi-country and 30.8% covered three or more countries. 21.7% of all trips used data in more than one region.
The most frequent country pairs, in rank order, were France and Spain, Austria and Germany, France and Italy, and France and the United Kingdom. The most common trip covering exactly two countries was Canada and the United States.
Multi-country trips were longer, a median of 17 days against 6, and used more per day: 0.242 GB against 0.152 GB for single-country trips. Part of the daily difference may reflect length, because most 1 to 3 day trips (88.0%) were single-country, and those short trips have the lowest recorded daily use. For more on how one eSIM handles several countries, see our guide to travel eSIMs for multiple countries.
How Much Does Mobile Data Actually Cost Travelers?
The median trip consumed $3.68 of mobile data, or $0.34 a day, at Bcengi's rates. 57.0% of trips consumed less than $5 of data, 73.2% less than $10, 87.2% less than $20 and 96.9% less than $50. A quarter of trips consumed more than $10.74, and one in ten more than $23.96.
This is the retail value of the data actually used, excluding tax. It is not what travelers loaded in advance, and it is not a price comparison with any other product.
- 1 to 3 days: median $0.24 per trip
- 4 to 7 days: median $2.12
- 8 to 14 days: median $3.89
- 15 to 30 days: median $7.78
- Over 30 days: median $17.86
From 4-day trips up, median daily cost was steady at $0.36 to $0.40. By destination, the highest median cost per trip was in Japan ($7.72) and China ($7.57) and the lowest in Switzerland ($1.10) and Singapore ($1.47).
For reference, Bcengi's rates for these destinations on October 1, 2026, per GB: Japan $2.82, China $1.68, Switzerland $1.81 and Singapore $1.54. Rates varied during 2026, and many trips covered more than one country.
What Happens When Real Usage Is Compared With Fixed Data Packages?
In a hypothetical comparison with a 3 GB allowance, 43.0% of trips would have used less than half of it and 41.6% would have needed more. Every comparison in this section is hypothetical: no sampled traveler is known to have bought any of these allowances, and each trip's observed use is set against an allowance of a given size.
Against 5 GB, 54.2% of trips would have used less than half and 29.3% would have needed more. The median trip, at 2.06 GB, would have used 68.8% of a 3 GB allowance, 41.3% of a 5 GB allowance and 20.6% of a 10 GB allowance.
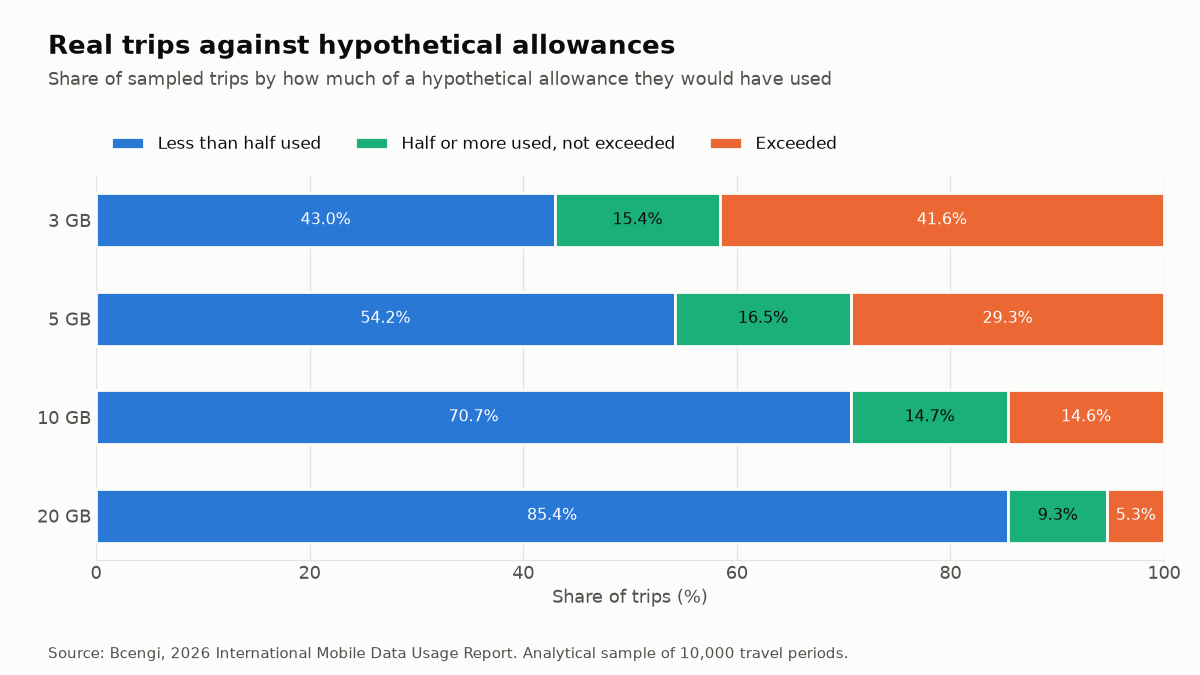
- 3 GB: 58.4% of trips would stay below it and 41.6% would exceed it. 43.0% would use less than half of it.
- 5 GB: 70.7% would stay below it and 29.3% would exceed it. 54.2% would use less than half, and 39.5% less than a quarter.
- 10 GB: 85.4% would stay below it and 14.6% would exceed it. 70.7% would use less than half, and 54.2% less than a quarter.
- 20 GB: 94.7% would stay below it and 5.3% would exceed it. 85.4% would use less than half.
The 5 GB result holds under other definitions. Leaving out one-day trips, 48.9% of trips would still use less than half of 5 GB. Across every combination of trip definition and one-day rule we tested, the share was between 46.3% and 56.8%. "About half" is the robust reading.
Does choosing by trip length solve it?
Only partly. Suppose a traveler picks the smallest common size (1, 3, 5, 10, 20 or 50 GB) that would have covered three out of four trips of their length:
- 4 to 7 days: 3 GB. 21.0% of these trips would exceed it, and 58.5% would use less than half of it.
- 8 to 14 days: 5 GB. 24.9% would exceed it, and 52.6% would use less than half.
- 15 to 30 days: 10 GB. 21.2% would exceed it, and 53.6% would use less than half.
Sizing up to cover nine out of ten trips (10, 10 and 20 GB) cuts the share exceeding the allowance to 3.2% to 8.9%, but then 75.1% to 88.8% of trips would use less than half of it.
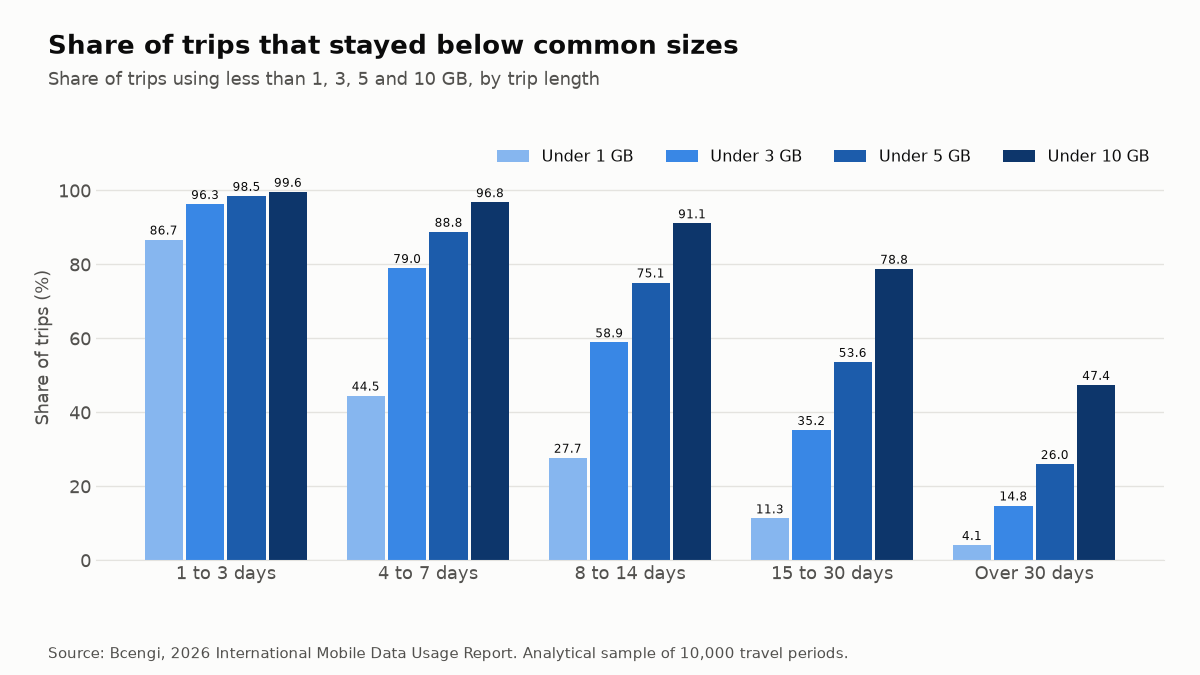
- 1 to 3 days: 86.7% under 1 GB; 96.3% under 3 GB; 98.5% under 5 GB; 99.6% under 10 GB.
- 4 to 7 days: 44.5% under 1 GB; 79.0% under 3 GB; 88.8% under 5 GB; 96.8% under 10 GB.
- 8 to 14 days: 27.7% under 1 GB; 58.9% under 3 GB; 75.1% under 5 GB; 91.1% under 10 GB.
- 15 to 30 days: 11.3% under 1 GB; 35.2% under 3 GB; 53.6% under 5 GB; 78.8% under 10 GB.
- Over 30 days: 4.1% under 1 GB; 14.8% under 3 GB; 26.0% under 5 GB; 47.4% under 10 GB.
Even the single most common "right size" for a trip length fits a minority of trips. For 4 to 7 day trips the most common right size is 1 GB, which fits 44.5% of them. For 8 to 14 day trips the most common, 3 GB, fits 31.2%, and for 15 to 30 day trips the most common, 10 GB, fits 25.3%.
Does a traveler's last trip predict the next one?
Only loosely. For travelers who came back for another trip, daily use on the new trip was within 50% either way of their own previous trip in 33.2% of cases. In 29.6% it was at least double, in 29.4% at most half, and the rest fell in between. The rank correlation between the two trips was 0.46.
What the Data Suggests About Pay-As-You-Go Data
What the data shows is that fixed allowance sizes are hard to choose in advance. The comparison is in gigabytes, not prices. Four results point the same way:
- Most trips are small relative to common allowance sizes. The median trip used 2.06 GB, and about half of trips (54.2%, or 48.9% leaving out one-day trips) would have used less than half of a 5 GB allowance.
- No single size fits a trip length. An allowance that covers three out of four trips of a given length is used less than half by 52.6% to 58.5% of them and exceeded by 21.0% to 24.9%.
- Use is hard to predict, even from experience. Among same-length trips the 90th percentile used 18 to 42 times as much as the 10th, and a traveler's previous trip landed within 50% of the next one only a third of the time.
- Travelers return and cross borders. 47.7% of trips used data in two or more countries, and returning travelers came back a median of 39 days after their last trip.
Together these mean that a traveler buying a fixed allowance must forecast their own use more precisely than the data suggests is possible. For many travelers, especially on short and medium trips, a model that bills only the data actually used avoids that forecast. That is the implication of the evidence; how much money it saves depends on prices this study does not cover.
Where a fixed allowance may still make sense
- Long stays. Trips of more than 30 days used a median of 10.85 GB, and 52.6% exceeded 10 GB. A 20 GB allowance would have covered 74.3% of them, with the median trip using 54.3% of it. Sizing is easier here, and price per GB matters more.
- Heavy users. The heaviest 10% of trips used 13.5 GB or more. For them the price per gigabyte of a large allowance, which this data cannot assess, is the deciding factor.
- Travelers whose use is stable. About a third of returning travelers stayed within 50% of their previous trip. Someone who knows their own pattern can size an allowance with more confidence.
How Often Do Travelers Come Back?
Among returning travelers, the median traveler started their next trip 39 days after the previous one ended. 38.1% came back after 60 or more days and 26.3% after 90 or more. A quarter came back within 16 days, and a quarter after more than 96 days.
Of trips that ended at least 180 days before the cutoff, 67.9% were followed by another trip by the same traveler within 180 days. Of trips that ended at least 90 days before the cutoff, 53.8% were followed by another trip within 90 days.
Trips on a previously used eSIM were lighter than first trips. They used a median of 1.27 GB over 8 days, against 3.07 GB over 13 days for a first trip on an eSIM. 45.1% of them used less than 1 GB, against 26.4% of first trips.
Unusual extremes, not typical behavior: the most traveled eSIMs reached 30 or more countries and 30 or more separate trips.
On this prepaid eSIM, value left on the account at the end of a trip stays available for the next trip. For background on how this works, see reusable travel eSIMs.
Other Patterns That Surprised Us
- Trips starting in June to August used more per day. Median daily use was 0.212 to 0.217 GB a day for trips starting in June, July or August, against 0.172 GB for trips starting in February or April, about a quarter more.
- Multi-country trips used more per day. 0.242 GB a day against 0.152 GB for single-country trips, though part of that gap may reflect their greater length.
- Repeat trips are lighter. Trips on a previously used eSIM used a median of 1.27 GB, less than half the 3.07 GB of first trips, partly because they were shorter.
- Most trips do not use data every day. In the median trip, data was used on 75% of the days between the first and last day of use.
- China stands apart. Its median daily use, 0.42 GB, was about 56% higher than Japan, the next highest.
- Many trips barely use data at all. 12.7% of trips used less than 100 MB in total.
What Travelers Can Take Away From the Data
- Typical needs are modest. In this sample, a 7-day trip (6 to 8 days) used a median of 1.38 GB and a 14-day trip 3.16 GB. Daily use was about 0.22 GB on trips of four days or more.
- Plan from percentiles, not averages. The 75th and 90th percentiles in the trip-length tables are a better guide to a cautious budget than any average, which heavy users inflate.
- Expect to differ from other travelers. Two travelers on trips of the same length often differ by five times or more.
- Your own last trip is only a rough guide. Only a third of returning travelers landed within 50% of their previous trip's daily use.
- Long and multi-country trips use more. Multi-country trips used a median of 4.29 GB against 0.91 GB for single-country trips, partly because they were longer, and trips of more than a month used a median of 10.85 GB.
- Fixed sizes are hard to pick. If you choose an allowance, the tables above show how often a given size would have been exceeded or left more than half unused for trips like yours.
Methodology
Data period and sample
- Data period: usage observed January 1, 2026 through September 30, 2026 (UTC). Included trips started between January 1 and August 31, 2026 and had ended by September 20, 2026.
- Sample: 10,000 travel periods drawn as a proportional stratified random sample from all eligible travel periods from 2026. Strata were start month, region of the main destination and trip-length group. Within each stratum, trips were drawn at random without replacement, so every eligible trip had essentially the same chance of selection. The sample is a genuine random subset, not the full set of eligible trips.
- Coverage: 171 main destinations and 185 countries with at least 1 MB of use, in all eight report regions.
What counts as a trip
- Travel period: a run of data use abroad on one eSIM. It ends after 10 or more consecutive days with no data use abroad, or when the eSIM uses data in the traveler's home country. The 10-day boundary is an analytical choice: the share of gaps during which the traveler used data at home climbs from 2.4% for gaps of 1 to 2 days to about 22% at 10 to 12 days, then levels off.
- Trip length: calendar days from the first to the last day with data use abroad, inclusive.
- Minimum use: 1 MB. An eSIM that was installed but used no data is not a trip, and such activity never counts as an earlier trip either.
- Main destination: the country with the most data used during the trip.
- Countries visited: countries with at least 1 MB of use during the trip.
- Traveler: the account the eSIM belongs to, with its stated home country. Data used in the home country is never part of a trip. Overlapping periods on one account are treated as one trip for return and gap figures.
- Trips over 90 days (8.1% of trips longer than 30 days) are kept but flagged, because they more likely reflect a home country on the account that differs from where the traveler lives. Without them the median for trips over 30 days is 10.19 GB rather than 10.85 GB.
Usage and cost
- Usage: all mobile data sent and received abroad during the trip. 1 GB is one billion bytes, the decimal unit allowances are usually sold in.
- Cost: the retail value of the data actually used, in US dollars excluding tax, at Bcengi's rates. It never includes amounts loaded in advance or remaining value.
Exclusions and anomalies
Before any analysis we excluded test, staff and development accounts, and accounts whose activity is far outside normal consumer travel use. Together they account for under 2% of data use. The same rules apply to every account, and the headline results move by a few tenths of a point at most with nothing excluded.
Statistics
- Percentiles: linear interpolation. Only medians and percentiles are reported, because the distribution is heavily skewed.
- Minimum subgroup size: a destination, region or home country is shown only if at least 100 different travelers in the sample have it. Its uncertainty was checked with bootstrap intervals that resample travelers, not trips, because one traveler can take several trips. Where the text says uncertainty ranges overlap, the 95% intervals of the two values overlap, so their order is not reliable; where it says a gap is larger than the uncertainty, the intervals do not overlap.
- Hypothetical allowances: 1, 3, 5, 10, 20 and 50 GB are compared with observed use only. "Unused" means the allowance minus observed use.
- Share explained: trip length is the strongest single factor we found. It accounts for about half of the differences in usage between trips: an adjusted R² of 0.46 for the length groups and 0.52 for exact length, measured on the logarithm of data use. Part of even that is built in, because length is measured from the days with data use. Destination explains about 6% on its own, and adding it to trip length raises the share explained only from 0.46 to 0.48. Home country explains about 6% and region about 2%. Destinations and home countries without at least 30 sampled trips are pooled into one group.
- Gaps between trips: measured with the same 200-day look-back for every trip, counting only accounts already in use at the start of that look-back. Only gaps up to 180 days are reported.
- Returning travelers: an earlier trip counts only if it used at least 1 MB, the same rule as for every trip. Periods that overlapped in time on one account, such as two travelers on the same trip, were treated as one trip and never counted as a return. They made up 11.4% of trips.
Robustness
- Independent recalculation: every sampled trip was recomputed from individual usage records by a separate database query. Data totals matched for every trip; headline figures in GB differed by at most 0.005 GB, and shares by at most 0.05 percentage points.
- Other random draws of the same sample design gave stable results.
- Other trip definitions (7, 14, 21 and 30-day boundaries, and 10 days without the home-country rule): the median trip ranged from 1.85 to 2.39 GB, the share under 5 GB from 68.0% to 72.4%, and the 7-day median from 1.24 to 1.48 GB. No finding changed direction.
- Sampling uncertainty: the 95% bootstrap interval for the overall median is 1.99 to 2.15 GB.
Privacy
All analysis used anonymized identifiers. No names, contact details or phone line identifiers were extracted, and the report publishes only aggregated figures for groups of at least 100 travelers. Single extreme observations are shown only as bands, such as "30 or more countries".
Limitations
- Interest: because Bcengi sells a pay-as-you-go eSIM, it has an interest in the pricing question this report discusses.
- Self-selection: everyone sampled chose a pay-as-you-go eSIM. The results describe these travelers, not all travelers.
- Bcengi's travelers only: the sample leans toward travelers from a few home countries, chiefly English-speaking ones, and toward summer months.
- Unobserved factors: Wi-Fi use, device type, apps used, trip purpose and whether a home SIM was roaming in parallel are not visible. Several people can share one account.
- Trip edges are approximate: length is measured from days with data use.
- Censoring: long July and August trips still running at the cutoff are missing, which biases long-trip figures slightly downward. Gaps between trips longer than 180 days are not reported.
- Season: the data covers trips starting January to August only, with no fourth-quarter holiday season.
- Price: there is no data on fixed package prices, so no money comparison is made. Regional differences, and low use in Mexico and India, may partly reflect price.
Using This Research
Journalists, publishers, bloggers, researchers and affiliates may quote the statistics in this report and reasonably reproduce its charts and tables, with attribution and a link to this page.
Suggested attribution: Source: Bcengi, 2026 International Mobile Data Usage Report, https://www.bcengi.com/c/2026-international-mobile-data-usage-report
When quoting a figure, please keep its definition: for example, "the median trip in the 2026 research sample used 2.06 GB," and describe allowance comparisons as hypothetical.